
D J
shared a media post in group #🖼📷Art
Not “Art”, but #Data is beautiful
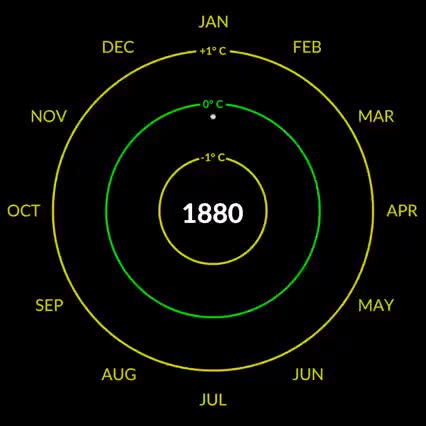
This mesmerizing visualization presents monthly global temperature anomalies between the years 1880-2021.
The 'climate spiral' is a visualization designed by climate scientist Ed Hawkins from the National Centre for Atmospheric Science, University of Reading.
Climate spiral visualizations have been widely distributed, a version was even part of the opening ceremony of the Rio de Janeiro Olympics.
Watch it till the end.